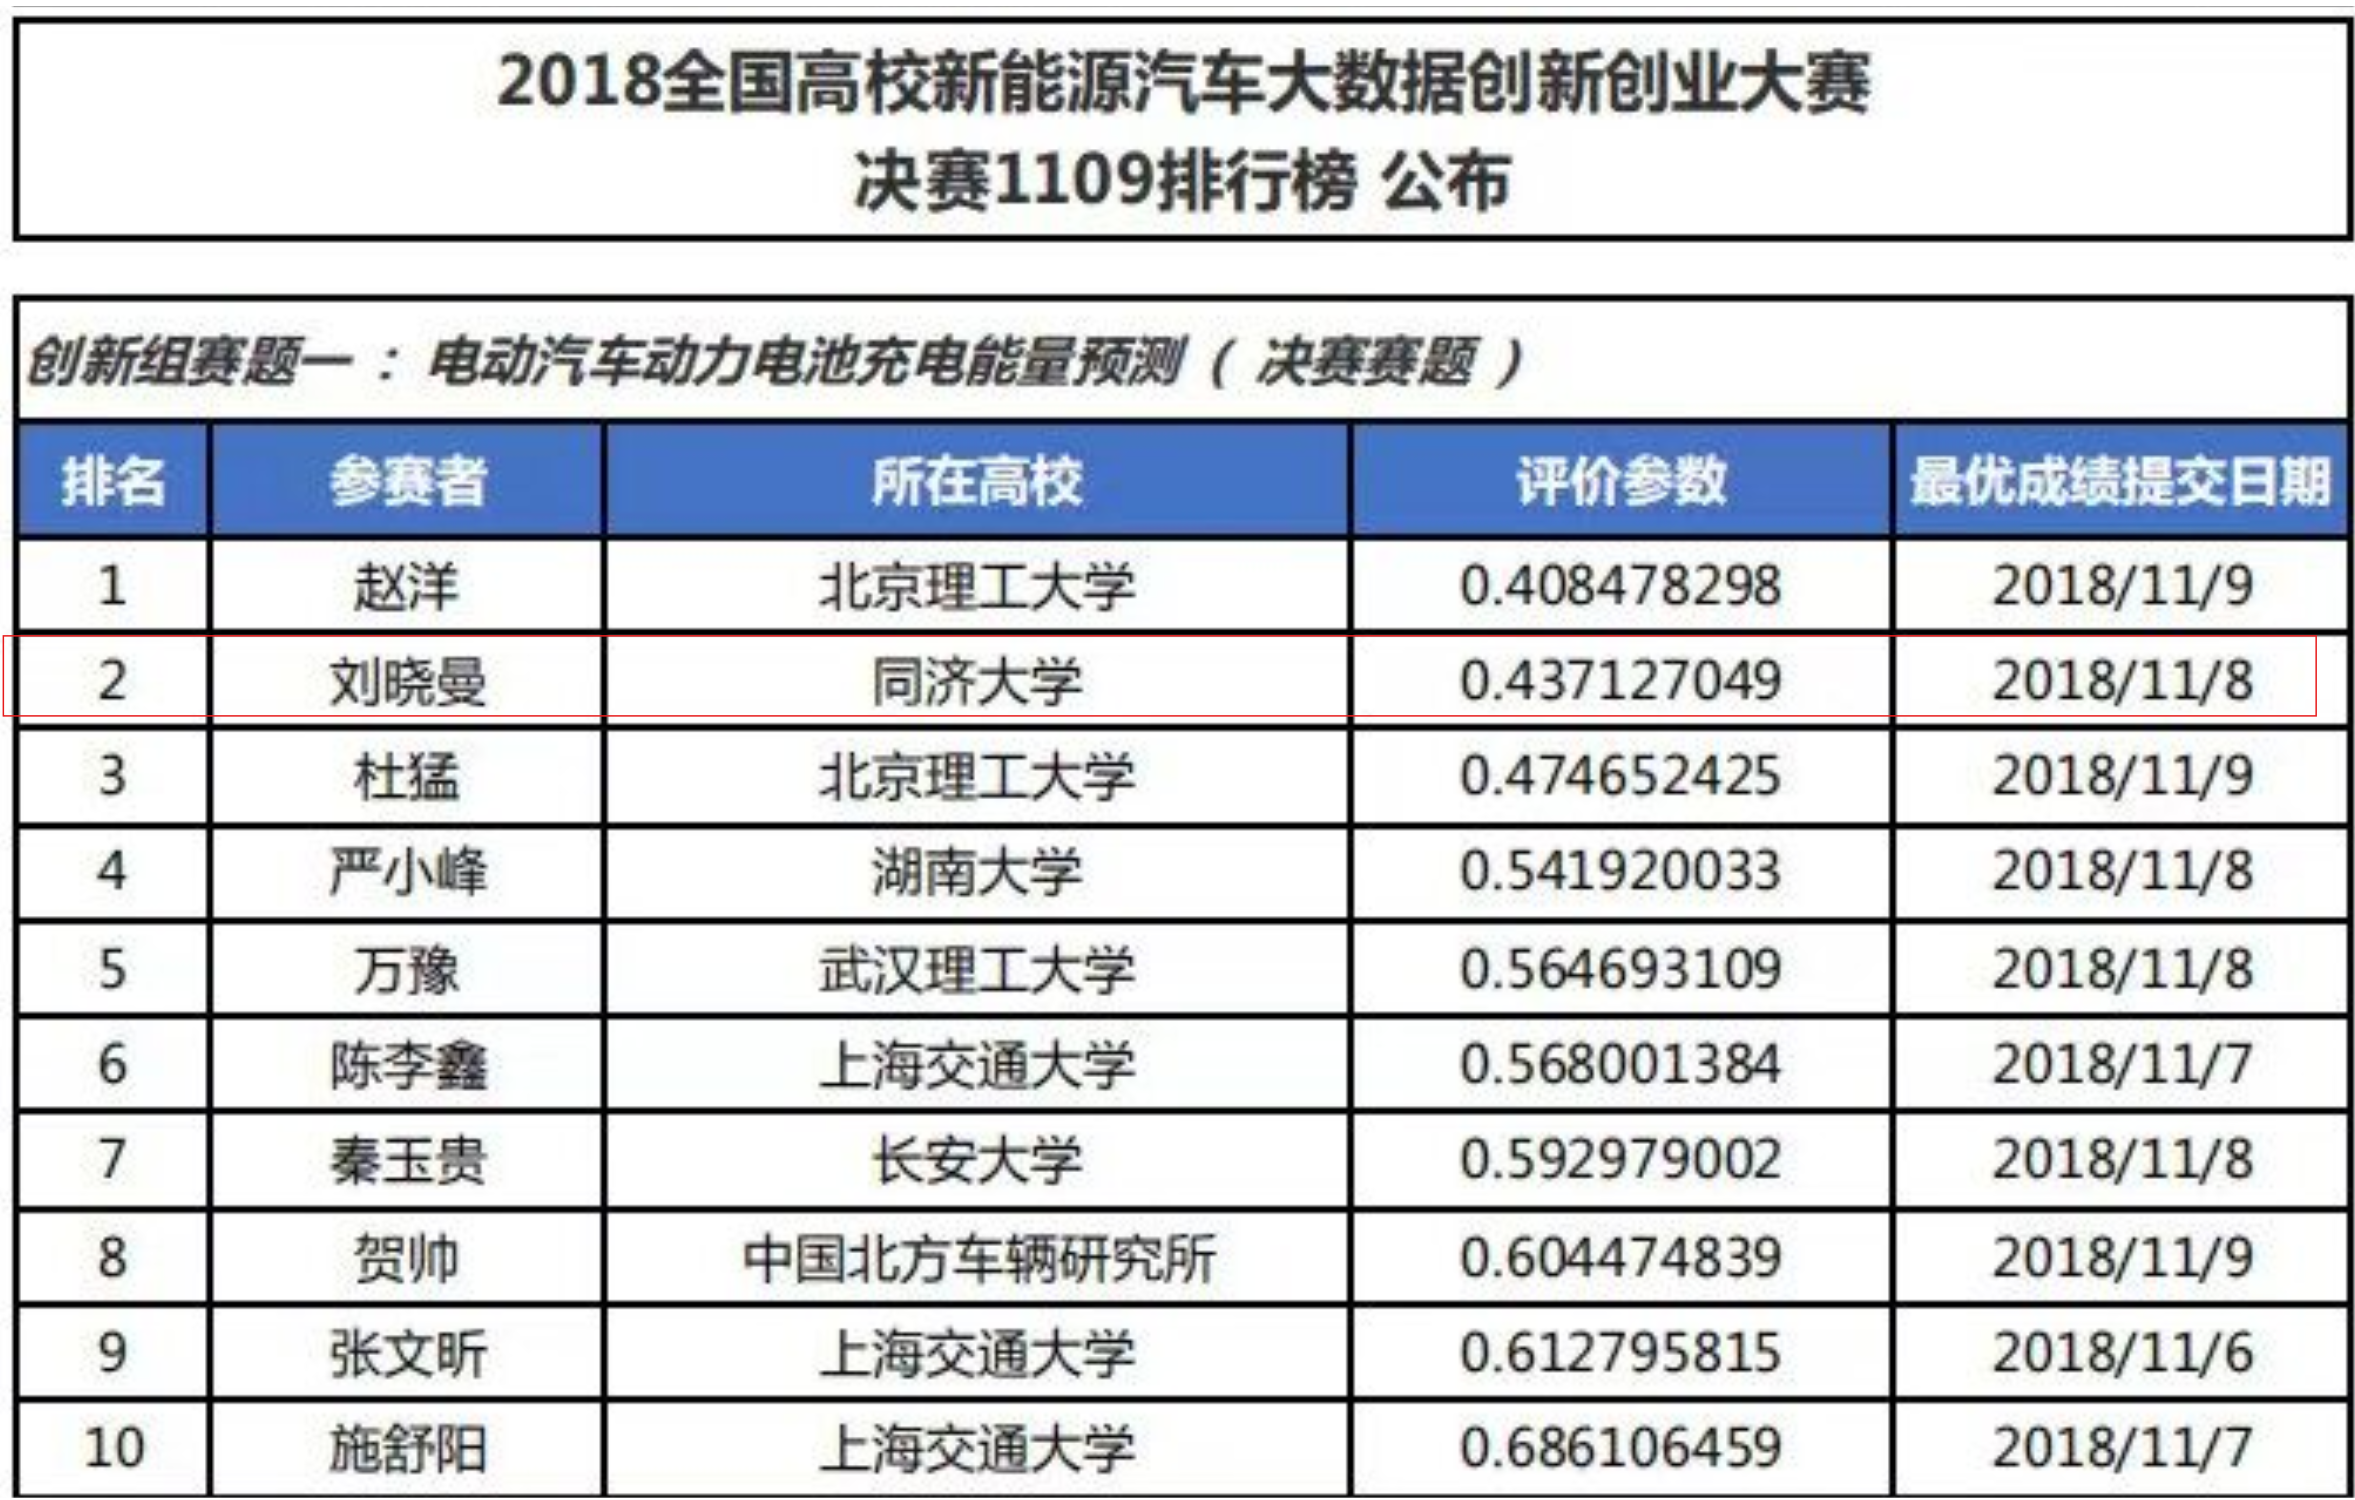
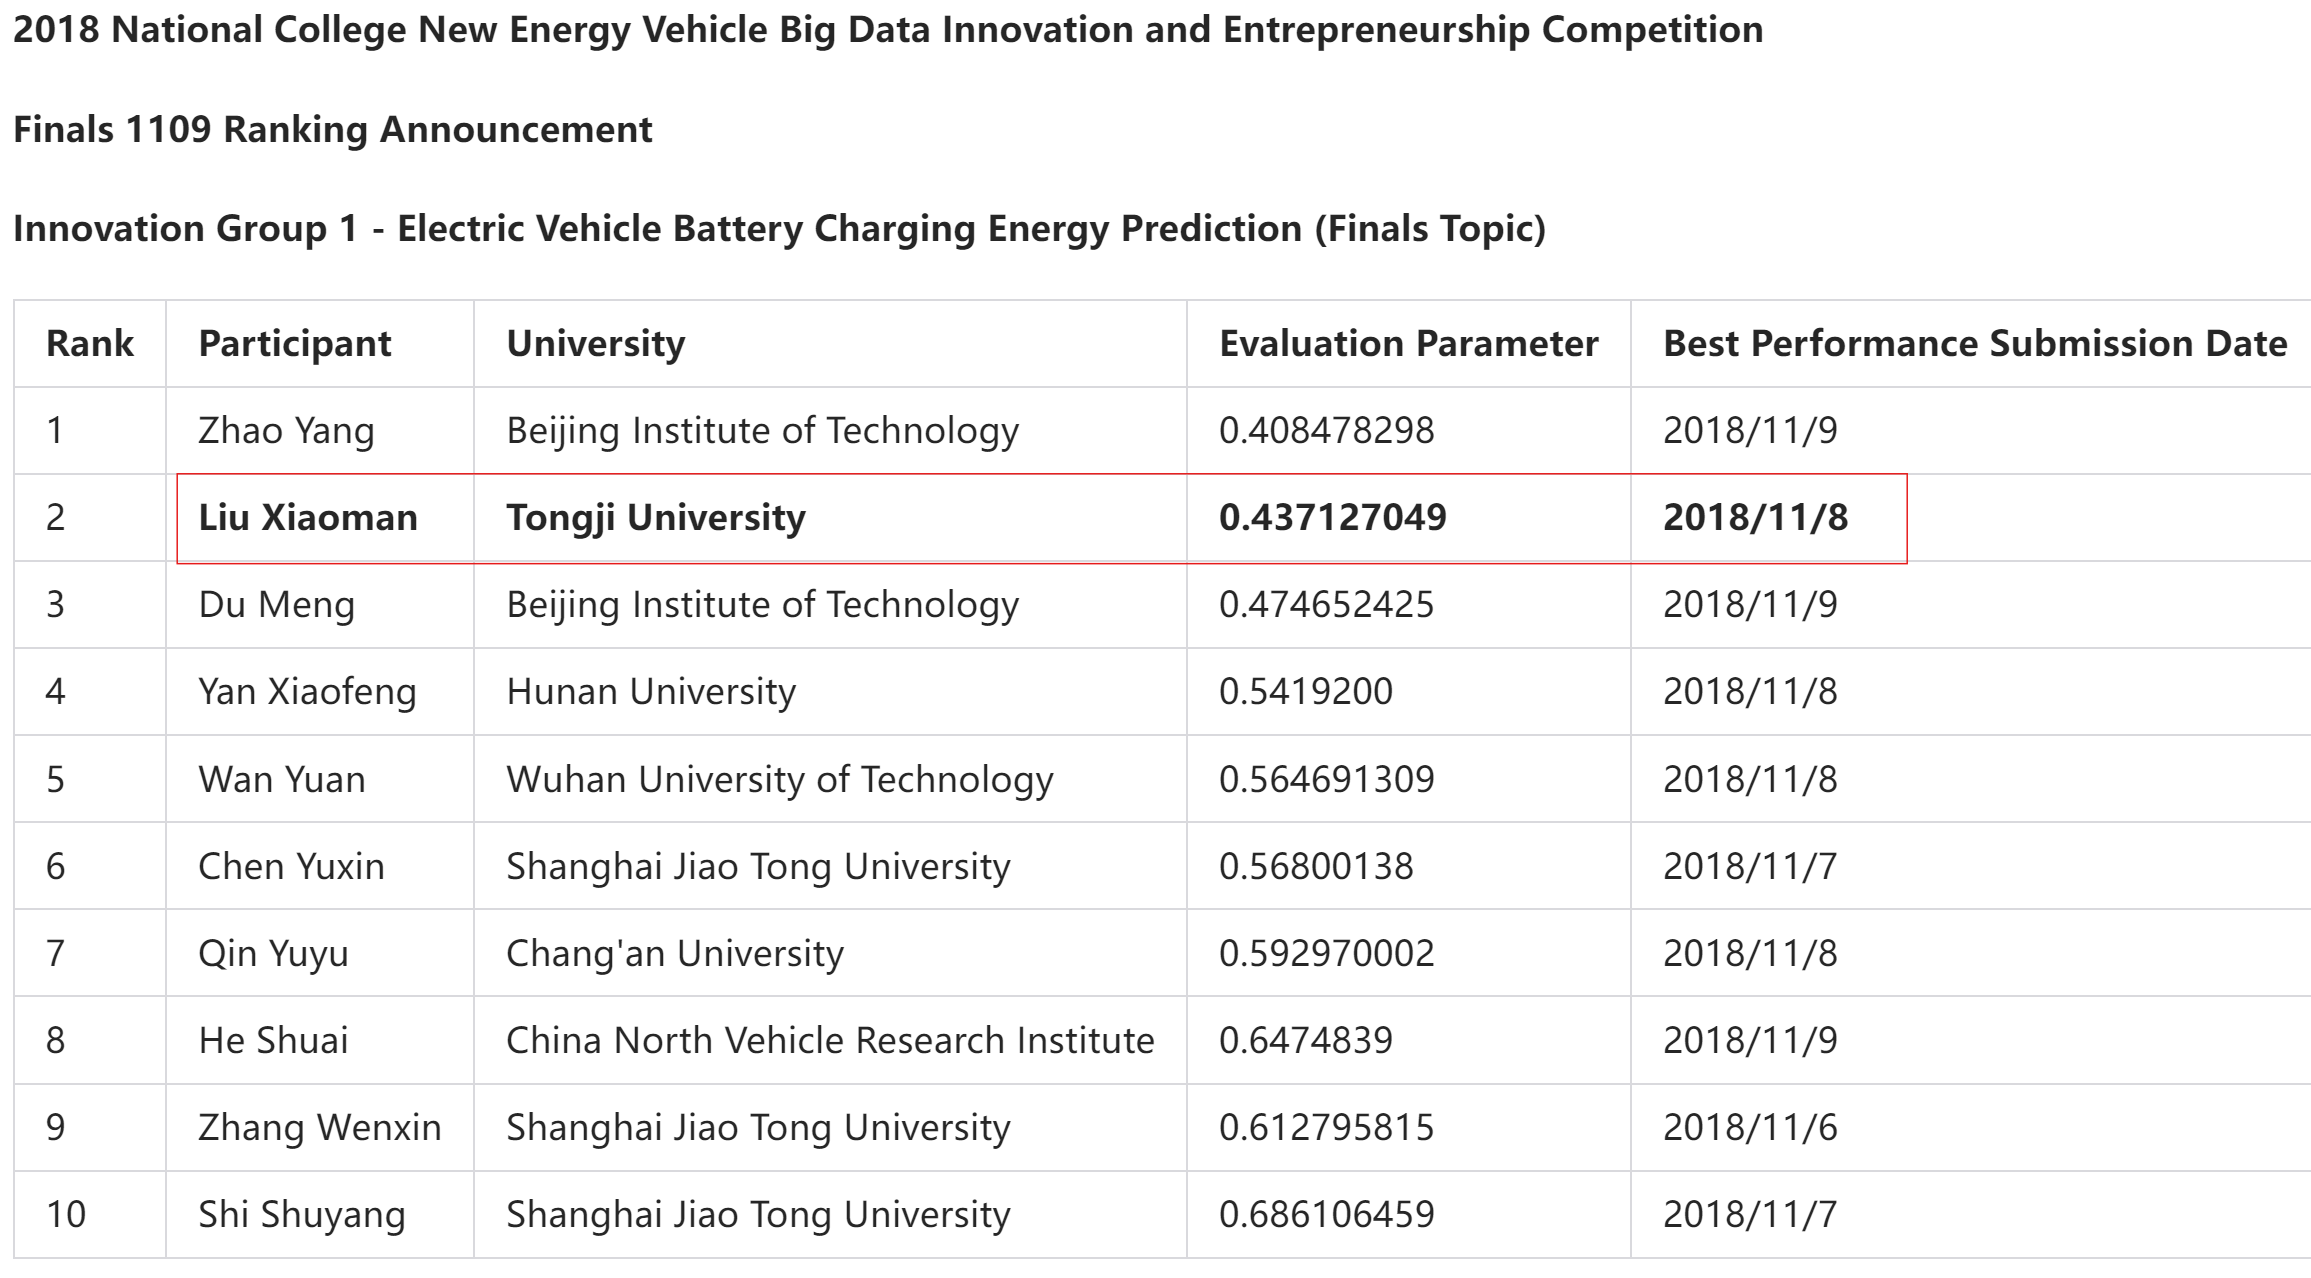
Second Place in EV battery charging energy prediction


Background
The prediction of power battery charging energy is the core issue of power battery decline assessment, and it is correctly predicted. Measure the charging energy of the power battery, evaluate the residual value of the power battery, fault detection, charging planning, etc.
The charging energy of power battery is affected by the coupling of multiple factors such as cumulative mileage and temperature. Competitors must design a power battery energy prediction model to predict the charging energy of the power battery. This question gives the charging state and charging energy of the first n charging processes to be predicted.Participants are required to predict the charging energy of the n+1st charging process.
Data
Data Description
Various parameters of the charging process are provided, and participants need to identify any anomalies in the data.
Data Format
Table 1: Training Sample Data Format and Description
| COLUMNS | TYPE | NOTES |
|---|---|---|
| vehicle_id | STRING | Unique vehicle identification code |
| charge_start_time | INT | Charging start time |
| charge_end_time | INT | Charging end time |
| mileage | FLOAT | Vehicle odometer mileage at the start of charging (km) |
| charge_start_soc | INT | Battery SOC at the start of charging |
| charge_end_soc | INT | Battery SOC at the end of charging |
| charge_start_U | FLOAT | Total battery voltage at the start of charging (V) |
| charge_end_U | FLOAT | Total battery voltage at the end of charging (V) |
| charge_start_I | FLOAT | Total battery current at the start of charging (A) |
| charge_end_I | FLOAT | Total battery current at the end of charging (A) |
| charge_max_temp | FLOAT | Maximum temperature of the battery system during charging (°C) |
| charge_min_temp | FLOAT | Minimum temperature of the battery system during charging (°C) |
| charge_energy | FLOAT | Charging energy for this process (kWh) |
Table 2: Test Sample Data Format and Description
| COLUMNS | TYPE | NOTES |
|---|---|---|
| vehicle_id | STRING | Unique vehicle identification code |
| charge_start_time | INT | Charging start time |
| charge_end_time | INT | Charging end time |
| mileage | FLOAT | Vehicle odometer mileage at the start of charging (km) |
| charge_start_soc | INT | Battery SOC at the start of charging |
| charge_end_soc | INT | Battery SOC at the end of charging |
| charge_start_U | FLOAT | Total battery voltage at the start of charging (V) |
| charge_end_U | FLOAT | Total battery voltage at the end of charging (V) |
| charge_start_I | FLOAT | Total battery current at the start of charging (A) |
| charge_end_I | FLOAT | Total battery current at the end of charging (A) |
| charge_max_temp | FLOAT | Maximum temperature of the battery system during charging (°C) |
| charge_min_temp | FLOAT | Minimum temperature of the battery system during charging (°C) |
Table 3: Submission Content Data Format and Description
| COLUMNS | TYPE | NOTES |
|---|---|---|
| vehicle_id | STRING | Unique vehicle identification code |
| charge_energy | FLOAT | Charging energy for this process (kWh) |
Table 4: Driving Track Data Format and Description
| COLUMNS | TYPE | NOTES |
|---|---|---|
| vehicle_id | STRING | Unique vehicle identification code |
| time | INT | Time |
| state | INT | Vehicle state (1 for start, 2 for stop, 3 for other) |
| GPS_lat | FLOAT | Latitude |
| GPS_lon | FLOAT | Longitude |
Table 5: Submission Content Data Format and Description
| COLUMNS | TYPE | NOTES |
|---|---|---|
| vehicle_id | STRING | Unique vehicle identification code |
| track_mileage | FLOAT | Track mileage (km) |
Evaluation Rule
### Scoring Formula
For both the charging energy prediction and the driving track mileage calculation, the scoring formula is:
e = √(∑i=1n (ri – ai)2 / n)
Where:
– e is the evaluation parameter, with a smaller value indicating closer proximity to the actual answer.
– ri is the calculated energy or track mileage.
– ai is the actual energy or mileage.
– n is the total number of samples.
This formula calculates the root mean square error (RMSE) between the predicted values and the actual values.
Solution
Data Analysis and Cleaning
-
The data analysis involves processing the distribution of energy in the training set, revealing a log-normal distribution, and noting that the factors affecting charging energy have a multiplicative relationship.
-
In terms of data cleaning, techniques such as missing value detection and anomaly correction are used, including the use of random forests and gradient boosting trees to correct anomalies and fill in missing values.
Model Design
-
Model design is divided into basic feature groups, representative feature groups, and time feature groups, which include original features, difference features, ratio features, memory features, and time dimension features.
-
Various regression methods (such as Ridge Regression, Lasso Regression, and ElasticNet Regression) are used to address multicollinearity and feature selection issues
Algorithm Structure
-
Techniques such as K-fold cross-validation, Support Vector Regression (SVR), Gradient Boosting, and XGBoost are employed to enhance the robustness and accuracy of the model.
-
The document describes the applicable scenarios and advantages and disadvantages of different algorithms in detail.
Portability and Engineering Optimization:
-
Emphasis is placed on the portability of the model, making it suitable for edge computing scenarios and cloud computing environments. The model design focuses on simplification and efficiency to adapt to different data distributions and computing resources.
-
Practical applications in engineering are mentioned, such as using the Internet of Vehicles for big data aggregation and processing.
Results
2nd place
Through detailed data analysis and cleaning, complex model design and algorithm selection, and portability optimization for practical application scenarios, the team demonstrates their deep understanding and innovative capabilities in big data analysis and machine learning applications.
Share via:


